
People Dashboards
Turn workforce data into information people can actually make decisions with.
A dashboard should help someone notice something, understand it and decide what to do next. It should not simply display every metric the organisation happens to collect.
Questions we can help answer
Where is turnover increasing?
Which areas are experiencing the greatest absence pressure?
How is workforce composition changing?
Are recruitment outcomes improving?
Which measures genuinely help leaders make decisions?
When does a dashboard signal that deeper analysis is needed?
What we do
We work with you to identify the decisions the dashboard needs to support before deciding which measures belong on it.
Dashboards can bring together workforce composition, turnover, absence, recruitment, employee survey results and other people indicators.
We focus on clear definitions, useful comparisons and visualisation that helps users understand patterns rather than simply displaying numbers.
What you get
A tailored people dashboard designed around your organisation, audience and decision-making needs, alongside guidance on how the measures should be interpreted.
The cost of doing nothing
People problems are often visible in organisational data before they become obvious elsewhere.
If leaders cannot see a pattern developing, the organisation may only respond once it has become considerably more expensive to solve.
What might this look like?
Senior leaders have 40 workforce metrics and no clear picture
An organisation produces a monthly HR dashboard containing dozens of measures. Leaders receive the report, but conversations tend to focus on whichever number has changed most dramatically that month.
We work backwards from the decisions leaders actually need to make.
The redesigned dashboard focuses on a smaller number of measures across workforce size, recruitment, turnover, absence and employee experience. Trends are shown over time, relevant comparisons are included and measures are broken down where that adds decision value.
The dashboard reveals that overall turnover is stable, but turnover among newly recruited employees has increased for three consecutive quarters in one operational area.
Instead of simply reporting a company-wide turnover percentage, leaders now have a signal that prompts a deeper investigation into onboarding, role expectations and local management.
The value: the dashboard becomes an early-warning and decision-support tool rather than a monthly collection of statistics.
Indicative Pricing
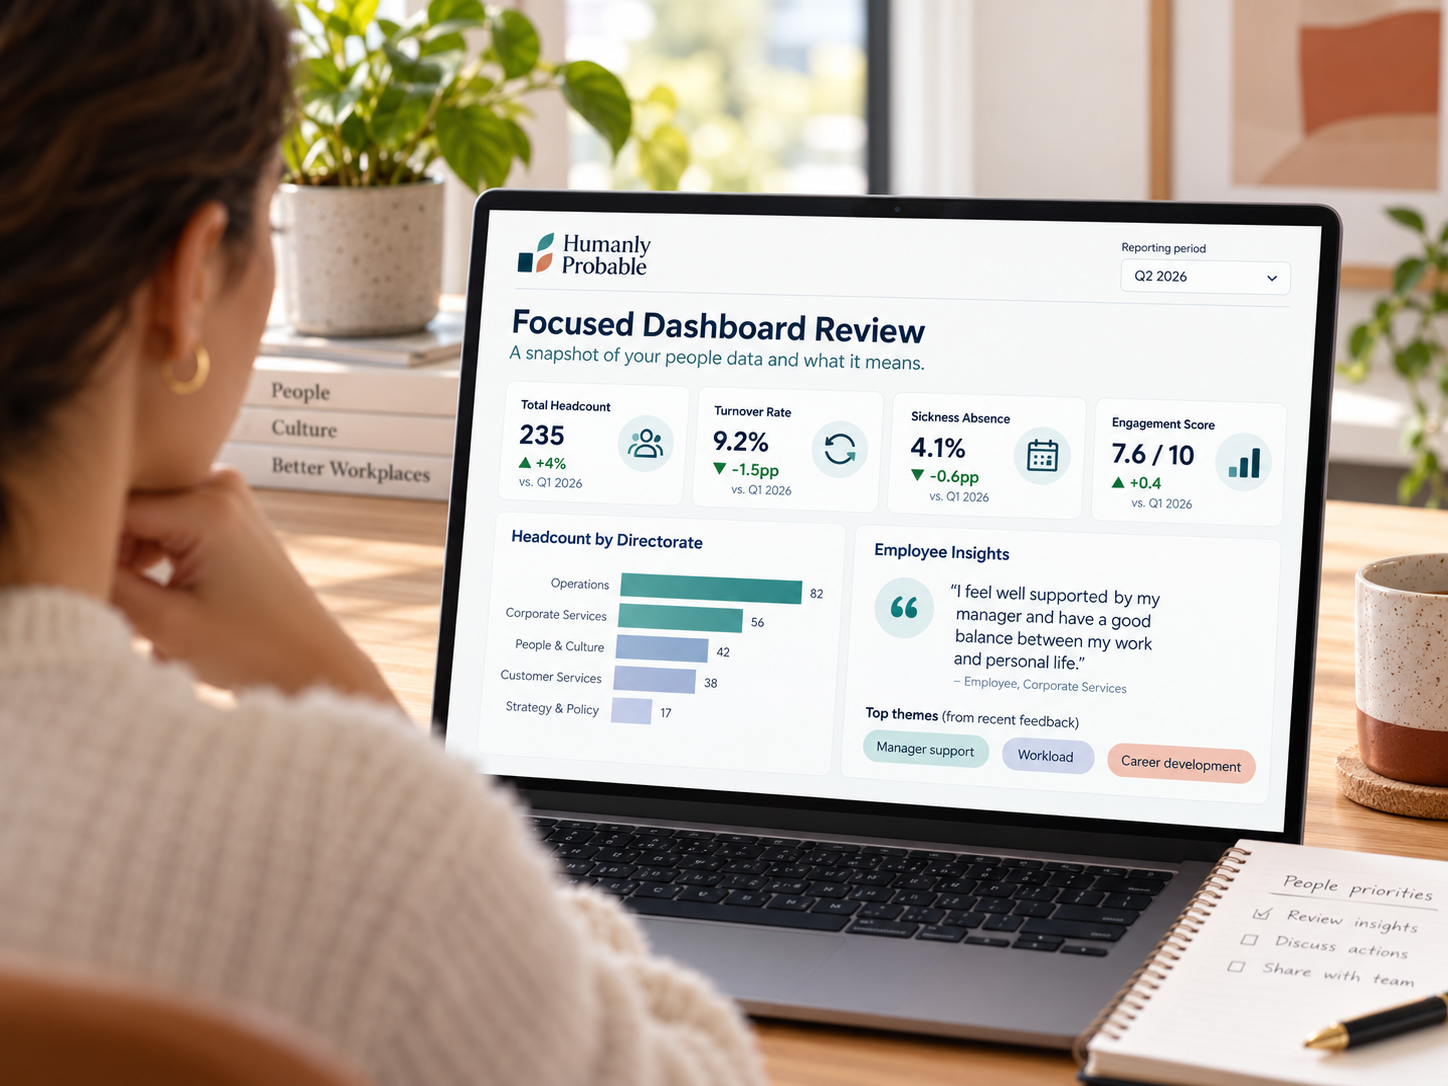
Focused People Dashboard
From £1,500
A clear, practical dashboard focused on one area of your people data, such as workforce composition, turnover, absence or recruitment. Designed around a small number of meaningful measures so you can quickly see what is changing and where attention may be needed.
Best for organisations that want to move beyond static reporting without building a large reporting system.
Comprehensive People Dashboard
Typically £2,500–£4,000
A broader dashboard bringing together several areas of people data to give leaders a more complete view of the workforce.
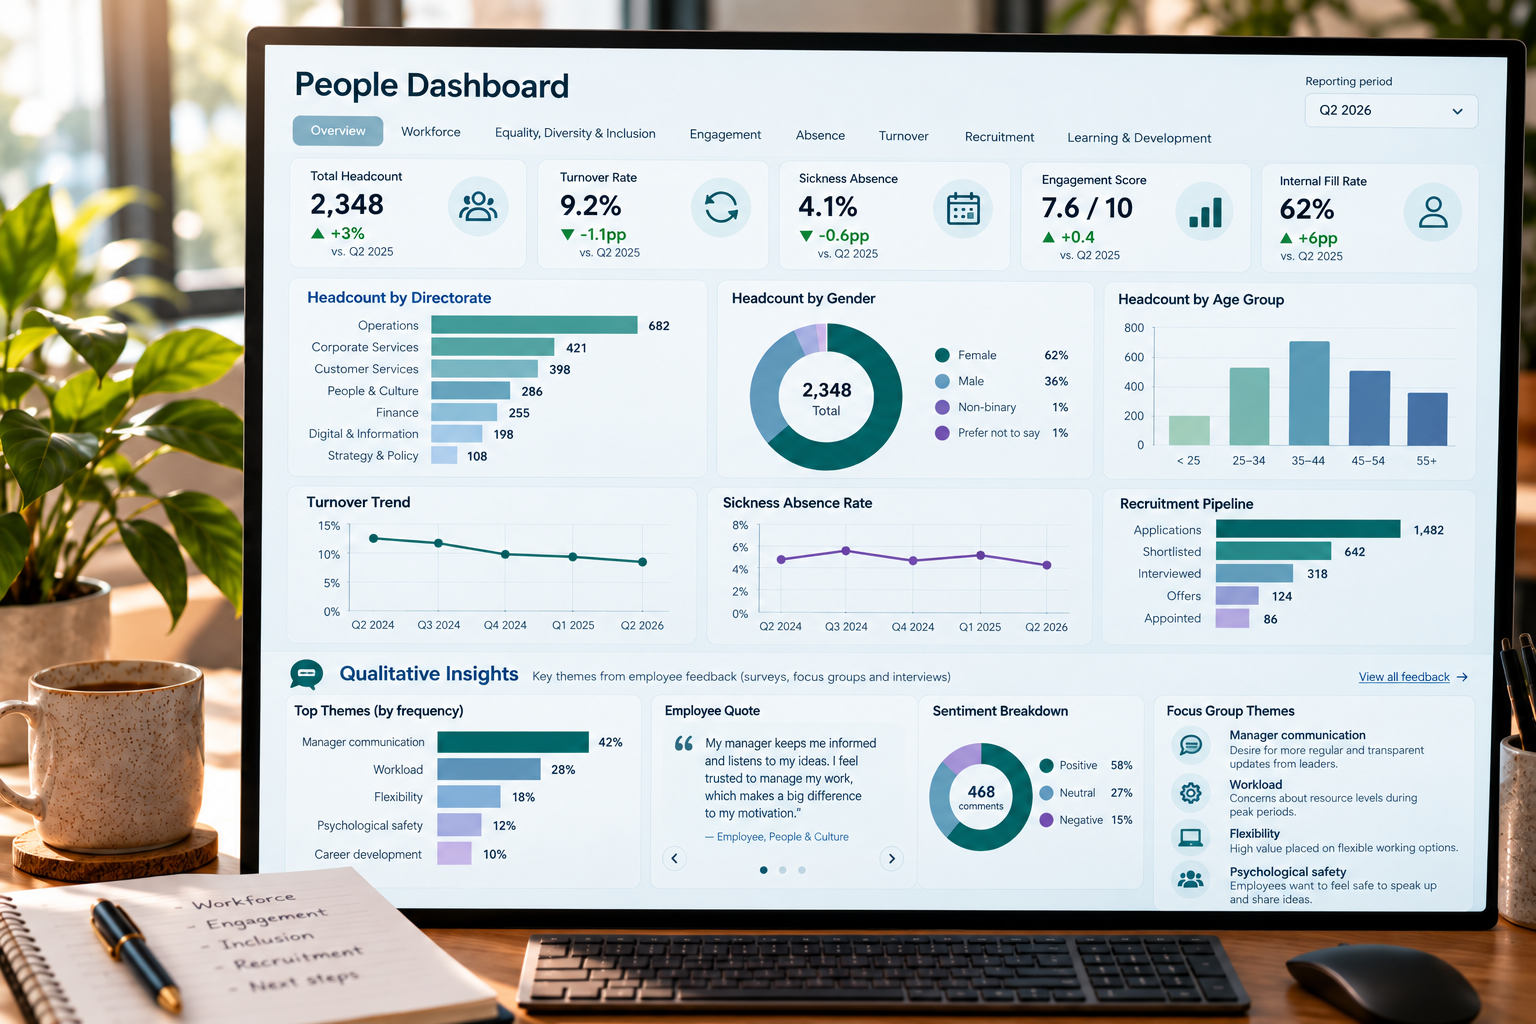
This can include workforce profile, turnover, absence, recruitment, engagement and inclusion measures, with filters and comparisons across teams, locations or employee groups. Survey results and qualitative themes can also be incorporated where useful.
Best for organisations that need one reliable place to explore people trends and support regular decision-making.

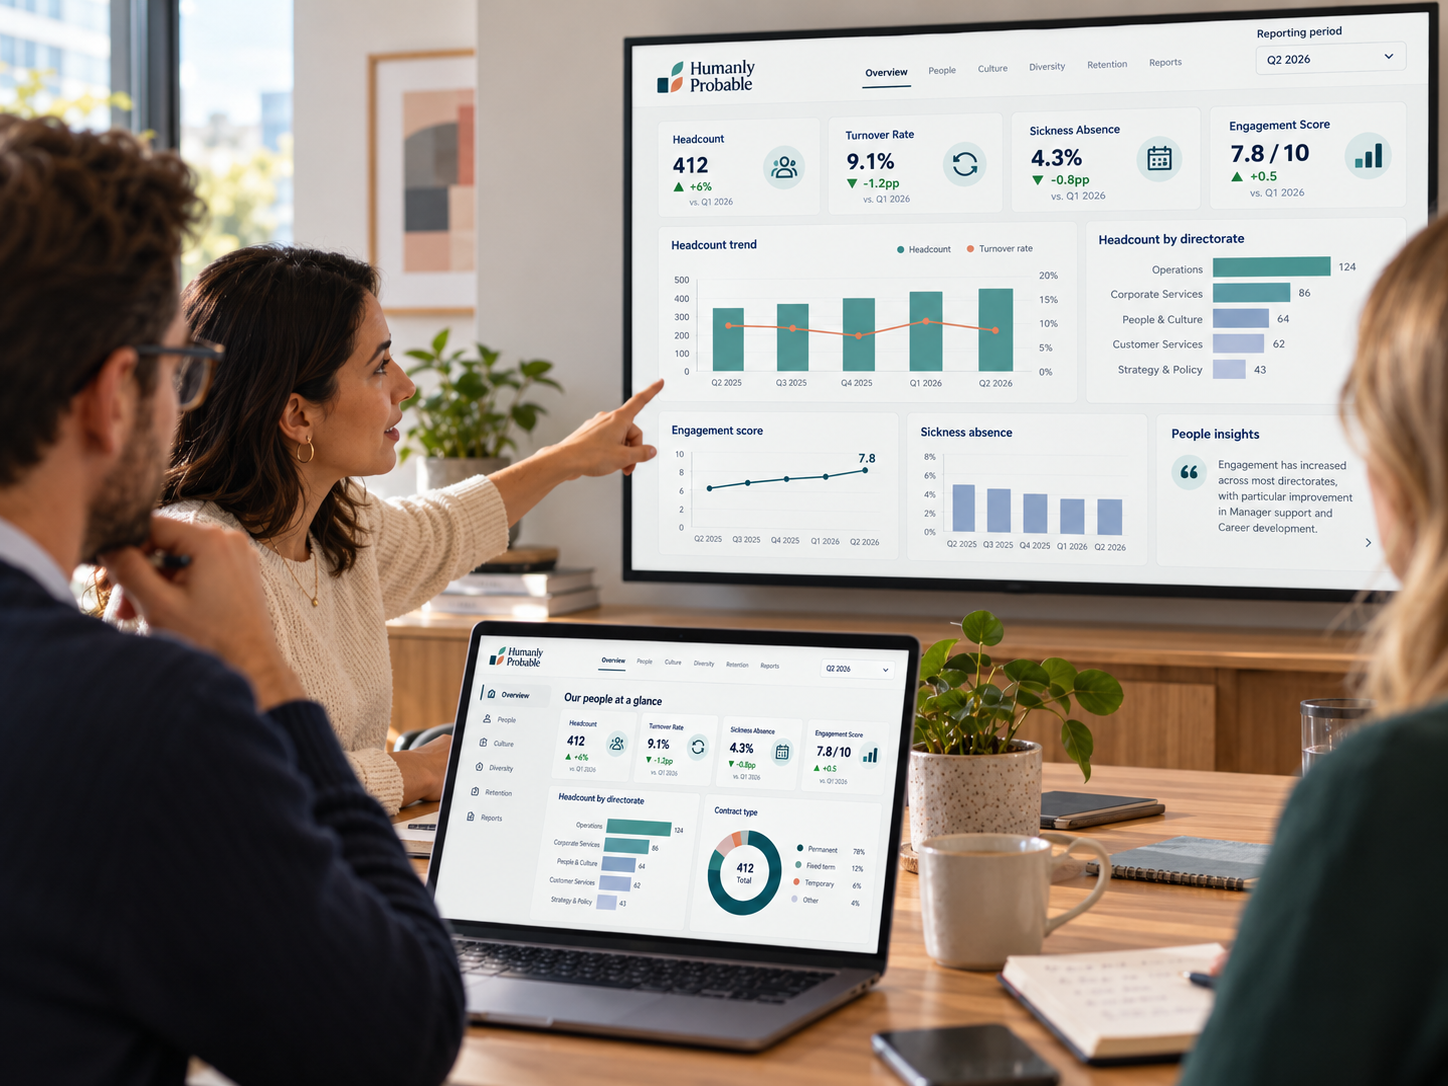
Strategic People Insights Dashboard
From £4,500+
A more sophisticated dashboard designed around strategic workforce questions rather than routine reporting alone.
It can combine multiple data sources, longer-term trends, employee survey results and qualitative insight, alongside deeper comparisons and interpretation. We work with stakeholders to identify the measures that matter, highlight emerging patterns and build a dashboard that supports action as well as monitoring.
Best for larger or more complex organisations wanting to connect what is happening in the data with what employees are actually experiencing.
Make your people data useful.
Tell us what your leaders need to see.
Pricing depends on the number of data sources, metrics, filters and user groups involved, the complexity of the build, and whether qualitative insight or ongoing support is included. We agree the scope and price before work begins.
Submit an Inquiry
Fill out the form and a member of the team will get back to you.
Alternatively email us at [email protected]